Edit chart
Loading graph
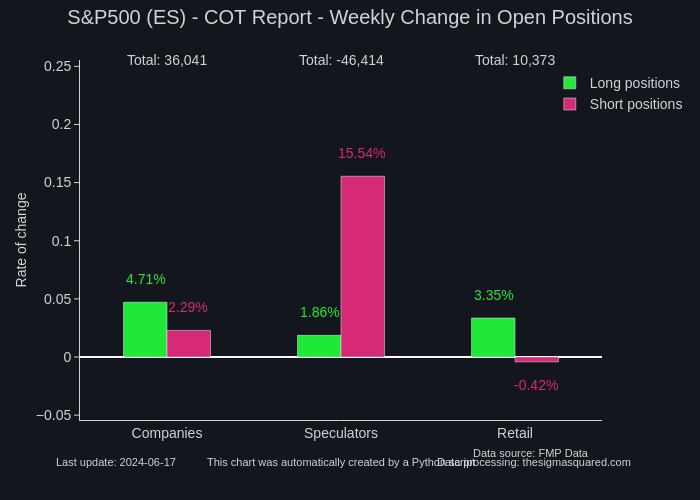
Neuro17's interactive graph and data of "S&P500 (ES) - COT Report - Weekly Change in Open Positions" is a grouped bar chart, showing Long positions vs Short positions; with Rate of change in the y-axis. The x-axis shows values from 0 to 0. The y-axis shows values from -0.08678343773940396 to 0.2863157436433298. This visualization has the following annotations: Data source: FMP Data; Data processing: thesigmasquared.com; This chart was automatically created by a Python script; Last update: 2024-05-13; 3.20%; -3.68%; 0.40%; -0.71%; 18.63%; 2.18%; Total: 55,464; Total: -52,828; Total: -2,636