Edit chart
Loading graph
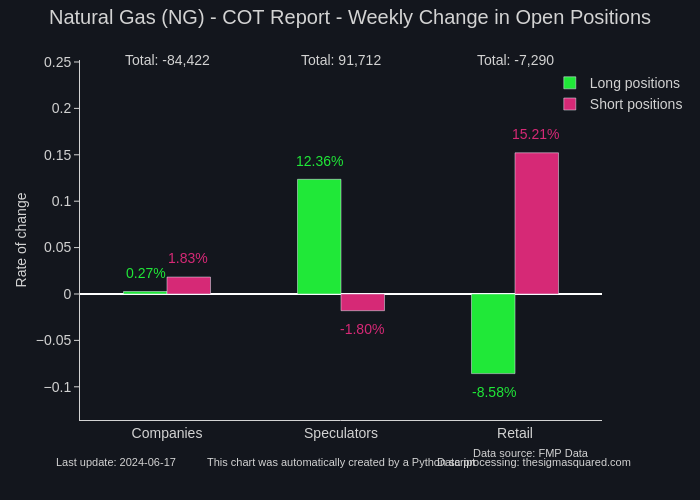
Neuro17's interactive graph and data of "Natural Gas (NG) - COT Report - Weekly Change in Open Positions" is a grouped bar chart, showing Long positions vs Short positions; with Rate of change in the y-axis. The x-axis shows values from 0 to 0. The y-axis shows values from -0.18528936490774744 to 0.2054355290264646. This visualization has the following annotations: Data source: FMP Data; Data processing: thesigmasquared.com; This chart was automatically created by a Python script; Last update: 2024-05-13; 0.70%; -0.20%; -3.16%; 1.20%; -13.53%; 10.54%; Total: -29,709; Total: 33,184; Total: -3,475