Edit chart
Loading graph
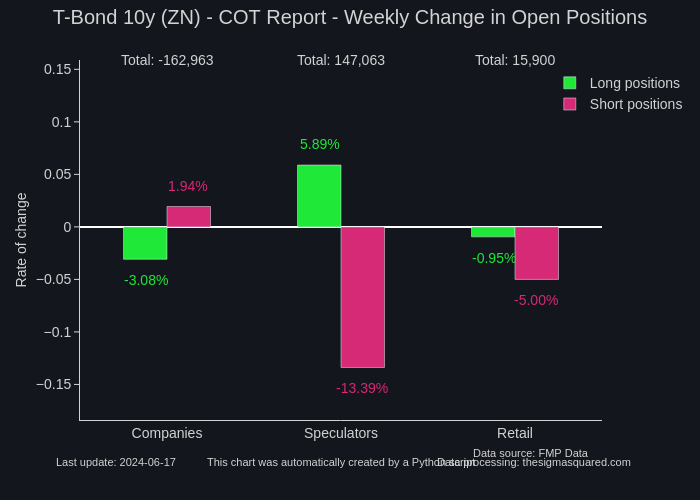
Neuro17's interactive graph and data of "T-Bond 10y (ZN) - COT Report - Weekly Change in Open Positions" is a grouped bar chart, showing Long positions vs Short positions; with Rate of change in the y-axis. The x-axis shows values from 0 to 0. The y-axis shows values from -0.1486002010349577 to 0.15984119519606424. This visualization has the following annotations: Data source: FMP Data; Data processing: thesigmasquared.com; This chart was automatically created by a Python script; Last update: 2024-05-13; 0.27%; 0.95%; 1.56%; 0.32%; 5.98%; -9.86%; Total: -57; Total: -48,655; Total: 48,712