Edit chart
Loading graph
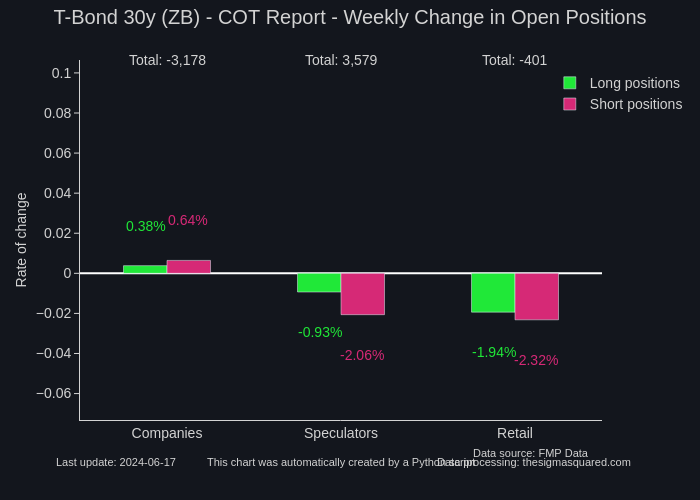
Neuro17's interactive graph and data of "T-Bond 30y (ZB) - COT Report - Weekly Change in Open Positions" is a grouped bar chart, showing Long positions vs Short positions; with Rate of change in the y-axis. The x-axis shows values from 0 to 0. The y-axis shows values from -0.06133563033249974 to 0.15167371826779488. This visualization has the following annotations: Data source: FMP Data; Data processing: thesigmasquared.com; This chart was automatically created by a Python script; Last update: 2024-05-13; 1.02%; 3.69%; 5.17%; 1.94%; 3.94%; -1.13%; Total: -10,283; Total: -1,555; Total: 11,838