Edit chart
Loading graph
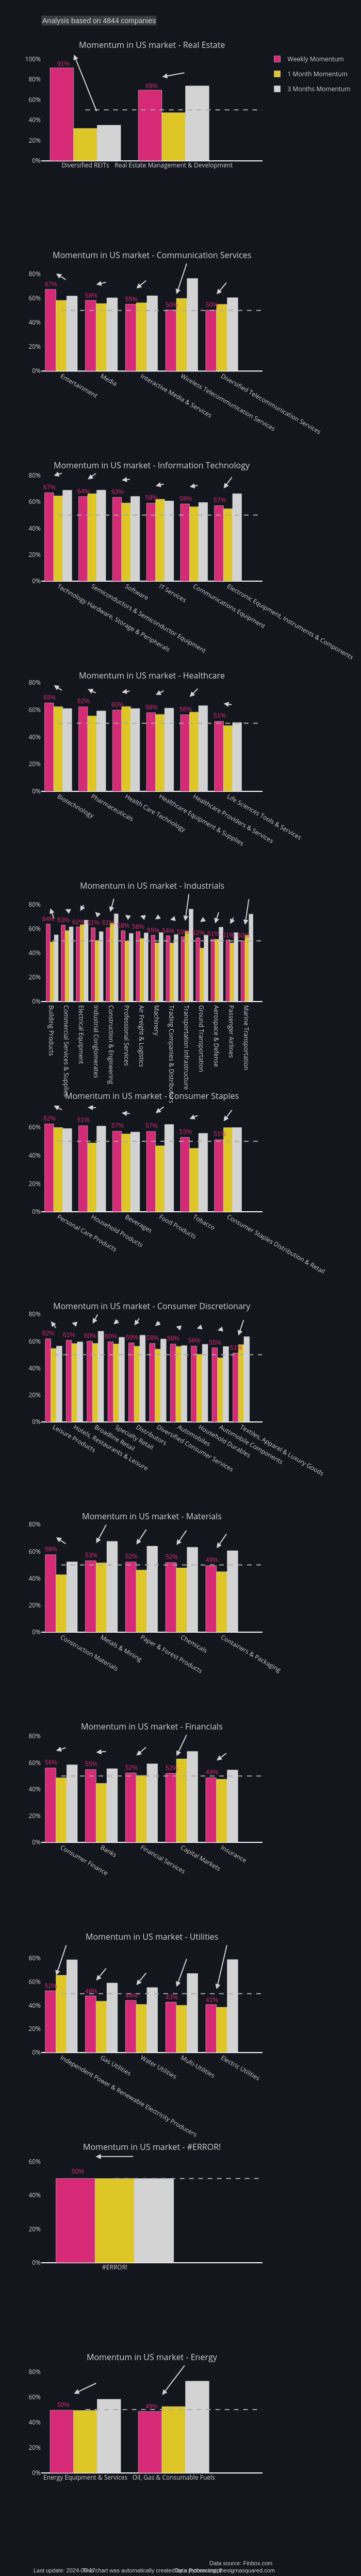
Neuro17's interactive graph and data of "Weekly Momentum, 1 Month Momentum, 3 Months Momentum, Weekly Momentum, 1 Month Momentum, 3 Months Momentum, Weekly Momentum, 1 Month Momentum, 3 Months Momentum, Weekly Momentum, 1 Month Momentum, 3 Months Momentum, Weekly Momentum, 1 Month Momentum, 3 Months Momentum, Weekly Momentum, 1 Month Momentum, 3 Months Momentum, Weekly Momentum, 1 Month Momentum, 3 Months Momentum, Weekly Momentum, 1 Month Momentum, 3 Months Momentum, Weekly Momentum, 1 Month Momentum, 3 Months Momentum, Weekly Momentum, 1 Month Momentum, 3 Months Momentum, Weekly Momentum, 1 Month Momentum, 3 Months Momentum" is a bar chart, showing Weekly Momentum, 1 Month Momentum, 3 Months Momentum, Weekly Momentum, 1 Month Momentum, 3 Months Momentum, Weekly Momentum, 1 Month Momentum, 3 Months Momentum, Weekly Momentum, 1 Month Momentum, 3 Months Momentum, Weekly Momentum, 1 Month Momentum, 3 Months Momentum, Weekly Momentum, 1 Month Momentum, 3 Months Momentum, Weekly Momentum, 1 Month Momentum, 3 Months Momentum, Weekly Momentum, 1 Month Momentum, 3 Months Momentum, Weekly Momentum, 1 Month Momentum, 3 Months Momentum, Weekly Momentum, 1 Month Momentum, 3 Months Momentum, Weekly Momentum, 1 Month Momentum, 3 Months Momentum. The x-axis shows values from 0 to 0. The y-axis shows values from 0 to 0. This visualization has the following annotations: Momentum in US market - Industrials; Momentum in US market - Consumer Staples; Momentum in US market - Real Estate; Momentum in US market - Utilities; Momentum in US market - Materials; Momentum in US market - Communication Services; Momentum in US market - Energy; Momentum in US market - Financials; Momentum in US market - Consumer Discretionary; Momentum in US market - Healthcare; Momentum in US market - Information Technology; 85%; 83%; 81%; 77%; 69%; 67%; 67%; 66%; 65%; 65%; 64%; 64%; 62%; 56%; 81%; 77%; 74%; 73%; 68%; 66%; 80%; 78%; 71%; 41%; 77%; 76%; 75%; 75%; 62%; 74%; 69%; 68%; 68%; 63%; 73%; 64%; 63%; 62%; 62%; 72%; 67%; 70%; 67%; 67%; 63%; 57%; 69%; 68%; 67%; 65%; 65%; 64%; 62%; 61%; 60%; 56%; 67%; 62%; 62%; 61%; 60%; 60%; 66%; 64%; 64%; 62%; 62%; 61%; Analysis based on 4845 companies; Data source: Finbox.com; Data processing: thesigmasquared.com; This chart was automatically created by a Python script; Last update: 2024-05-13