Edit chart
Loading graph
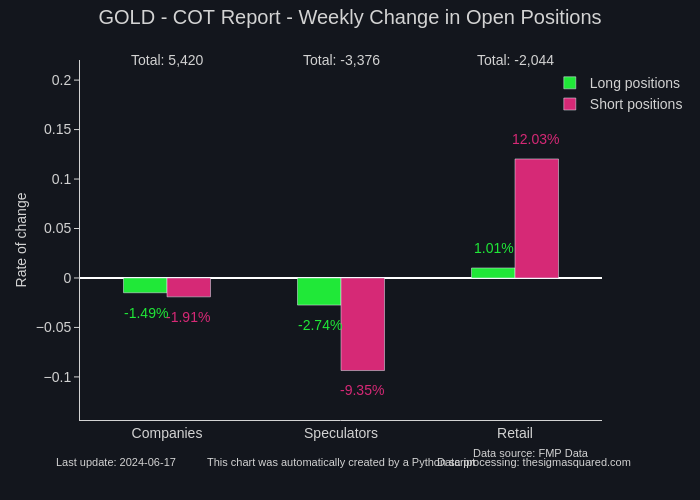
Neuro17's interactive graph and data of "GOLD - COT Report - Weekly Change in Open Positions" is a grouped bar chart, showing Long positions vs Short positions; with Rate of change in the y-axis. The x-axis shows values from 0 to 0. The y-axis shows values from -0.07763933547695608 to 0.18805744520030246. This visualization has the following annotations: Data source: FMP Data; Data processing: thesigmasquared.com; This chart was automatically created by a Python script; Last update: 2024-05-13; -1.60%; -2.40%; 8.81%; -0.64%; -2.76%; 0.06%; Total: 232; Total: -4,643; Total: 4,411