Edit chart
Loading graph
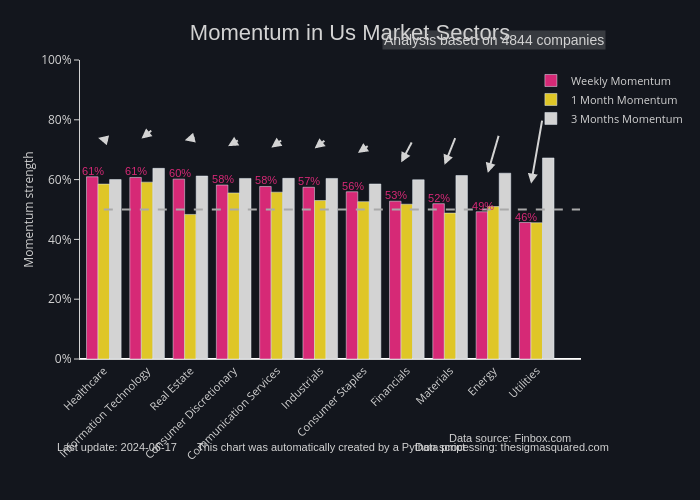
Neuro17's interactive graph and data of "Momentum in Us Market Sectors" is a grouped bar chart, showing Weekly Momentum, 1 Month Momentum, 3 Months Momentum; with Momentum strength in the y-axis. The x-axis shows values from 0 to 0. The y-axis shows values from 0 to 1. This visualization has the following annotations: Data source: Finbox.com; Data processing: thesigmasquared.com; This chart was automatically created by a Python script; Last update: 2024-05-13; Analysis based on 4845 companies; 72%; 72%; 69%; 68%; 66%; 66%; 65%; 65%; 63%; 63%; 62%