Edit chart
Loading graph
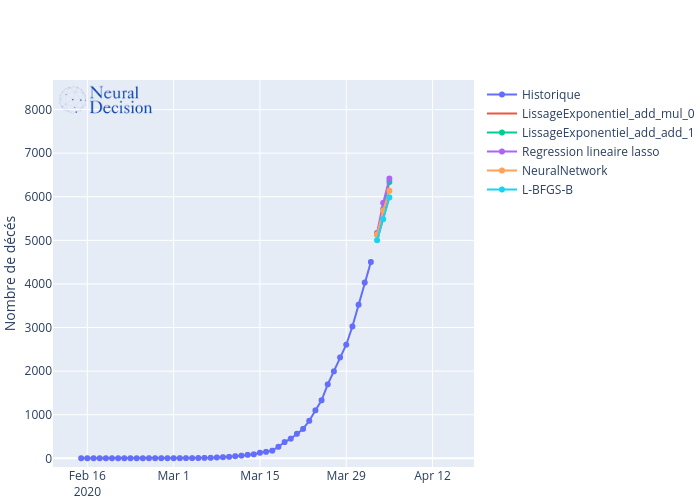
Neural-decision's interactive graph and data of "Nombre de décés vs time" is a line chart, showing Historique, LissageExponentiel_add_mul_0, LissageExponentiel_add_add_1, Regression lineaire lasso, NeuralNetwork, L-BFGS-B; with time in the x-axis and Nombre de décés in the y-axis.. The x-axis shows values from 2020-02-10 10:16:26.702 to 2020-04-18 17:26:41.1699. The y-axis shows values from -199.69712412550007 to 8678.679896909223.