Edit chart
Loading graph
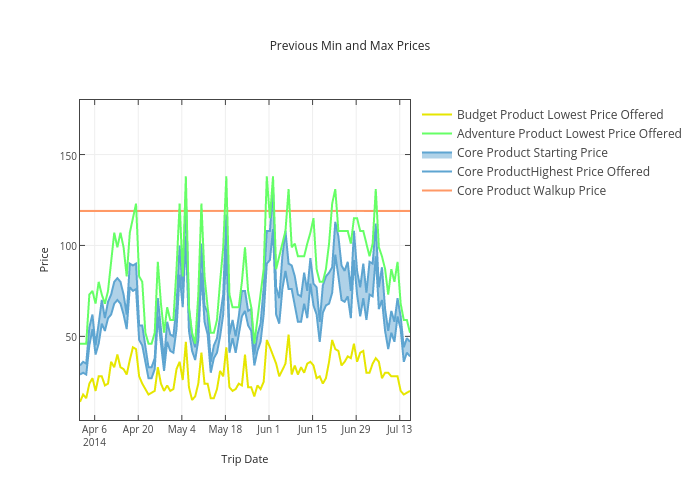
Neda's interactive graph and data of "Previous Min and Max Prices" is a line chart, showing Core Product Walkup Price, Core ProductHighest Price Offered, Core Product Starting Price, Adventure Product Lowest Price Offered, Budget Product Lowest Price Offered. The x-axis shows values from 0 to 0. The y-axis shows values from 0 to 0.