Edit chart
Loading graph
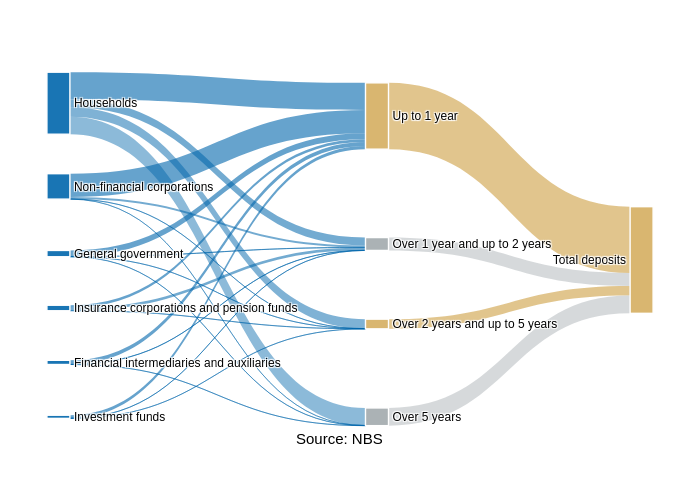
Nbs_sk's interactive graph and data is a sankey. The x-axis shows values from 0 to 0. The y-axis shows values from 0 to 0. This visualization has the following annotation: Source: NBS