Edit chart
Loading graph
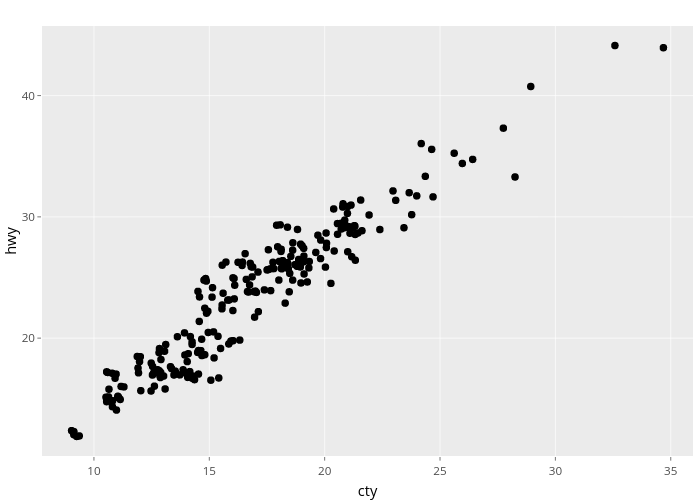
Nadhil2's interactive graph and data of "hwy vs cty" is a scatter chart; with cty in the x-axis and hwy in the y-axis.. The x-axis shows values from 7.74831553923432 to 35.9643577108858. The y-axis shows values from 10.2805388042238 to 45.7383988696616.