Edit chart
Loading graph
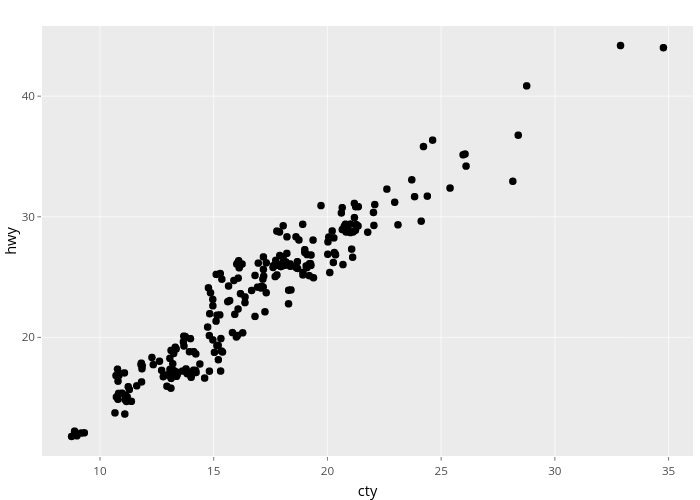
Nadhil2's interactive graph and data of "hwy vs cty" is a scatter chart; with cty in the x-axis and hwy in the y-axis.. The x-axis shows values from 7.45103286711499 to 36.0734780451097. The y-axis shows values from 10.1672528220154 to 45.8169777164422.