Edit chart
Loading graph
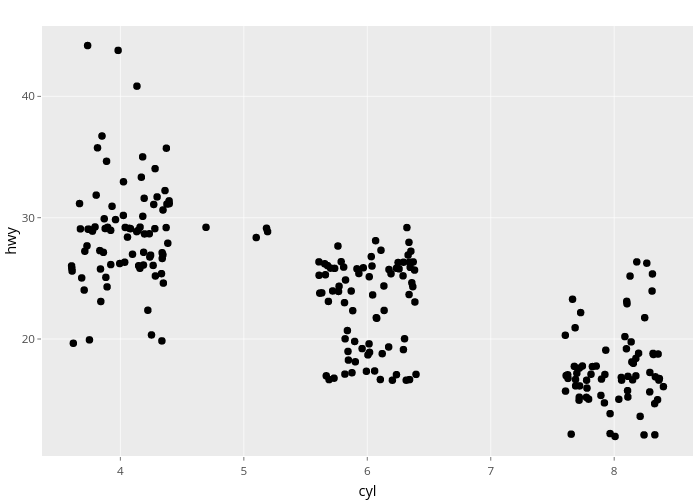
Nadhil2's interactive graph and data of "hwy vs cyl" is a scatter chart; with cyl in the x-axis and hwy in the y-axis.. The x-axis shows values from 3.36504727581516 to 8.63829422650859. The y-axis shows values from 10.3561926460918 to 45.8023571374733.