Edit chart
Loading graph
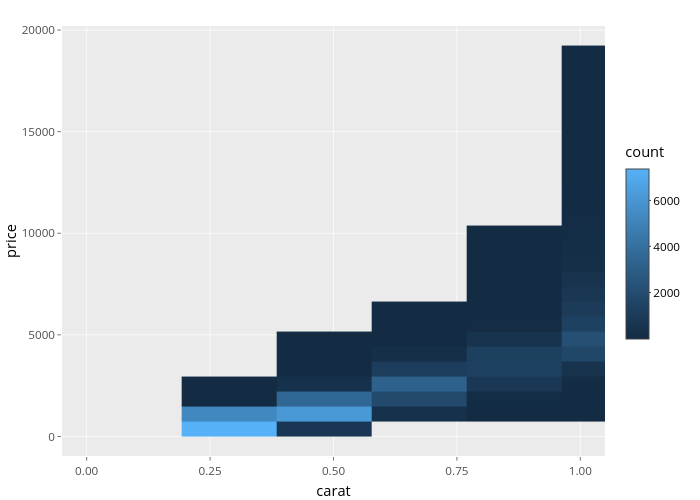
Nadhil's interactive graph and data of "price vs carat" is a heatmap, showing 99_3fb438c72b49f528da5b3b4d2e32f2f1; with carat in the x-axis and price in the y-axis.. The x-axis shows values from -0.05 to 1.05. The y-axis shows values from -961.8440813868 to 20198.7240813868.