Edit chart
Loading graph
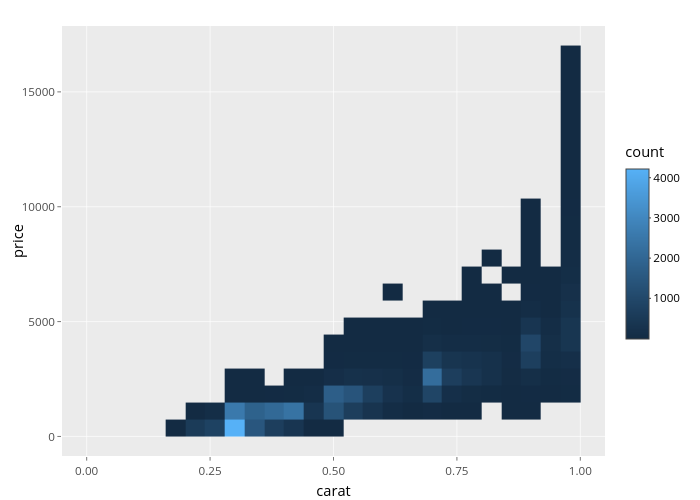
Nadhil's interactive graph and data of "price vs carat" is a heatmap, showing 99_21ecbcb164da2585b8c17f42b82df7f9; with carat in the x-axis and price in the y-axis.. The x-axis shows values from -0.05 to 1.05. The y-axis shows values from -850.8620813868 to 17868.1020813868.