Edit chart
Loading graph
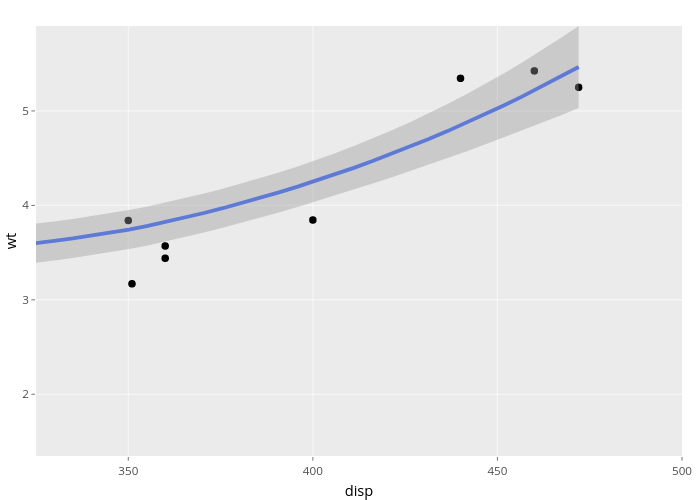
Nadhil's interactive graph and data of "wt vs disp" is a scatter chart, showing fitted values; with disp in the x-axis and wt in the y-axis.. The x-axis shows values from 325 to 500. The y-axis shows values from 1.34627593123602 to 5.8994626297702.