Edit chart
Loading graph
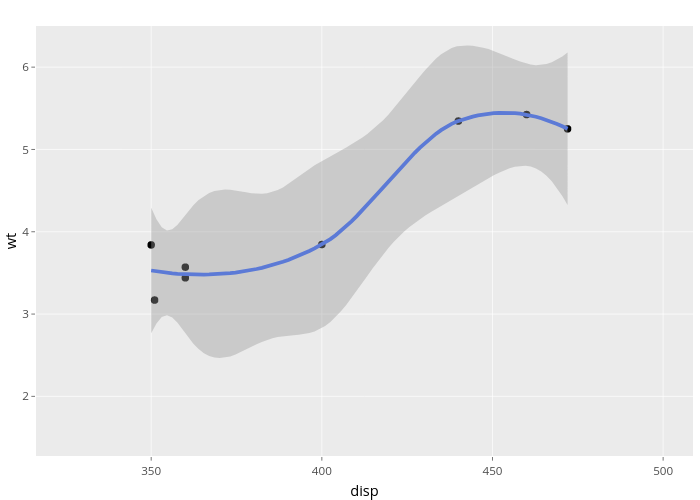
Nadhil's interactive graph and data of "wt vs disp" is a scatter chart, showing fitted values; with disp in the x-axis and wt in the y-axis.. The x-axis shows values from 316.25 to 508.75. The y-axis shows values from 1.27552466149868 to 6.49998210852768.