Edit chart
Loading graph
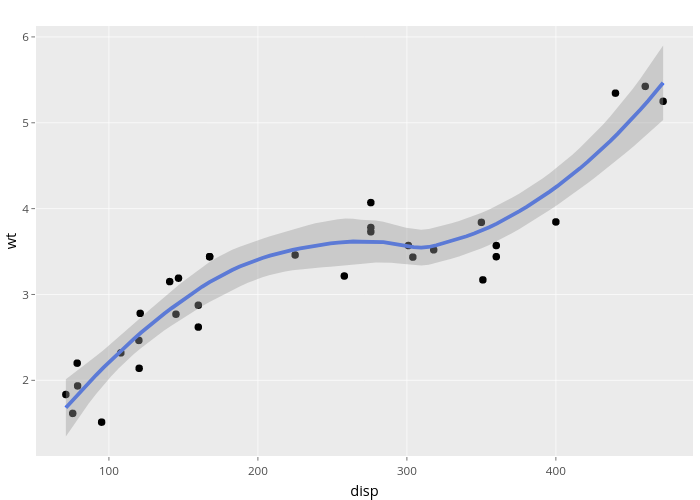
Nadhil's interactive graph and data of "wt vs disp" is a scatter chart, showing fitted values; with disp in the x-axis and wt in the y-axis.. The x-axis shows values from 51.055 to 492.045. The y-axis shows values from 1.11861659630931 to 6.12712196469691.