Edit chart
Loading graph
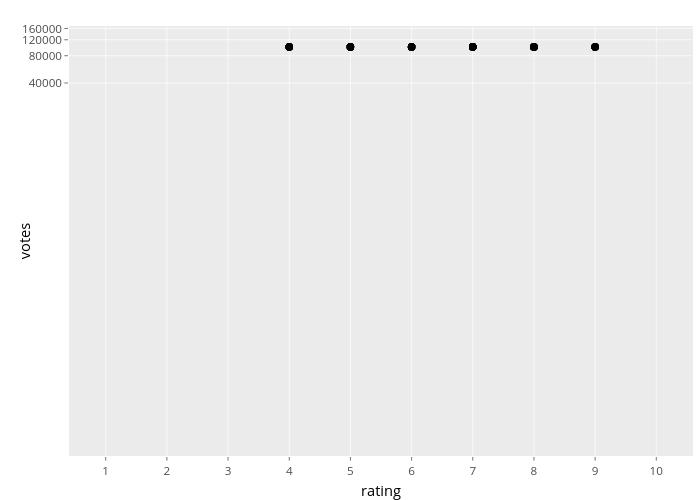
Nadhil's interactive graph and data of "votes vs rating" is a scatter chart; with rating in the x-axis and votes in the y-axis.. The x-axis shows values from 0.4 to 10.6. The y-axis shows values from 0.483144020105202 to 5.23131567318317.