Edit chart
Loading graph
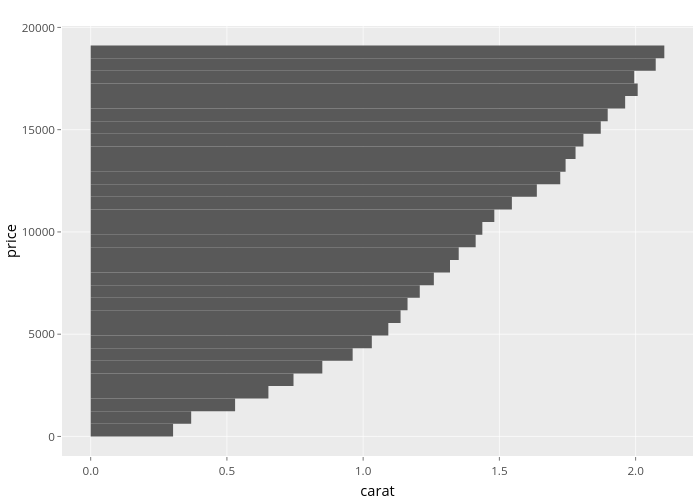
Nadhil's interactive graph and data of "price vs carat" is a bar chart; with carat in the x-axis and price in the y-axis.. The x-axis shows values from -0.105266990291262 to 2.21060679611651. The y-axis shows values from -955.678401155667 to 20069.2450678223.