Edit chart
Loading graph
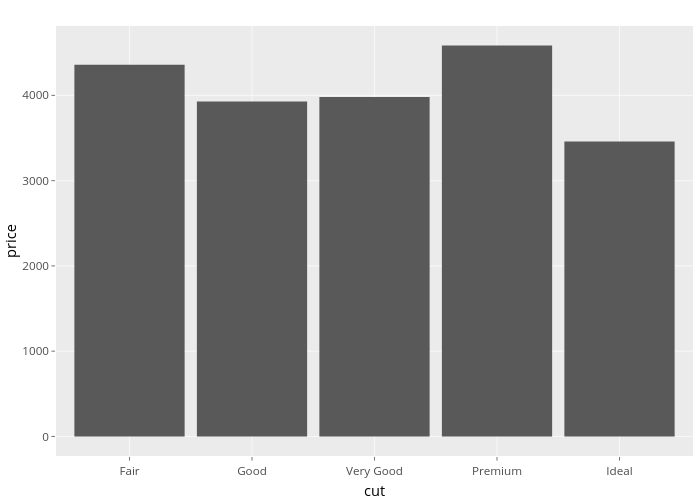
Nadhil's interactive graph and data of "price vs cut" is a bar chart; with cut in the x-axis and price in the y-axis.. The x-axis shows values from 0.4 to 5.6. The y-axis shows values from -229.212885214995 to 4813.4705895149.