Edit chart
Loading graph
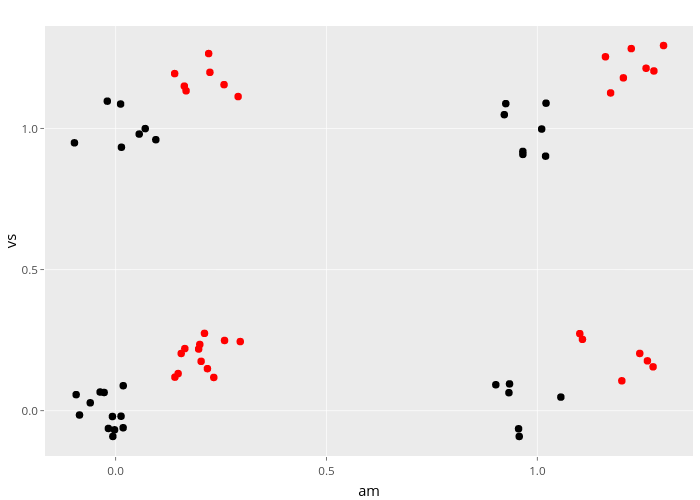
Nadhil's interactive graph and data of "vs vs am" is a scatter chart; with am in the x-axis and vs in the y-axis.. The x-axis shows values from -0.167376658716239 to 1.36895851485897. The y-axis shows values from -0.160811681104824 to 1.3632134345267.