Edit chart
Loading graph
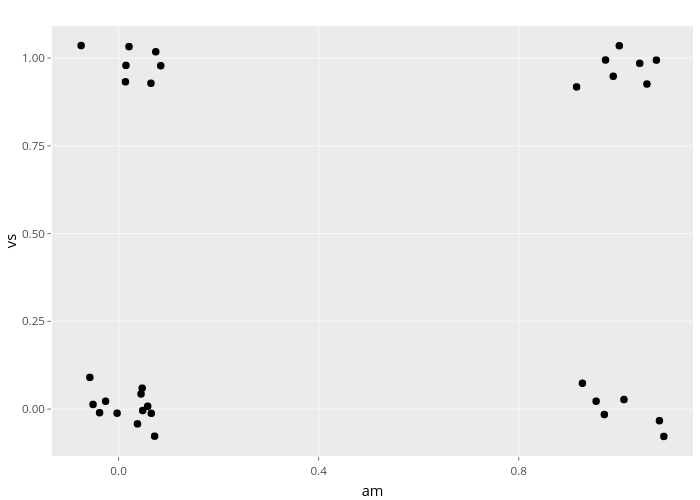
Nadhil's interactive graph and data of "vs vs am" is a scatter chart; with am in the x-axis and vs in the y-axis.. The x-axis shows values from -0.133152369346935 to 1.14851663874695. The y-axis shows values from -0.133675433734898 to 1.09138209809782.