Edit chart
Loading graph
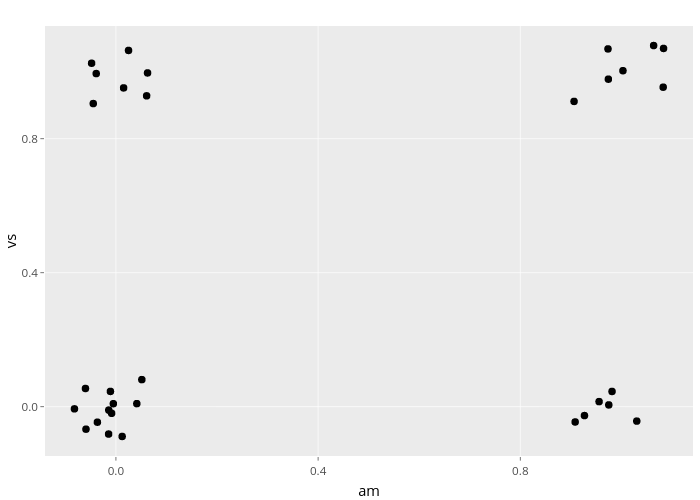
Nadhil's interactive graph and data of "vs vs am" is a scatter chart; with am in the x-axis and vs in the y-axis.. The x-axis shows values from -0.140263536104467 to 1.14150094534038. The y-axis shows values from -0.14732340825256 to 1.13635073173326.