Edit chart
Loading graph
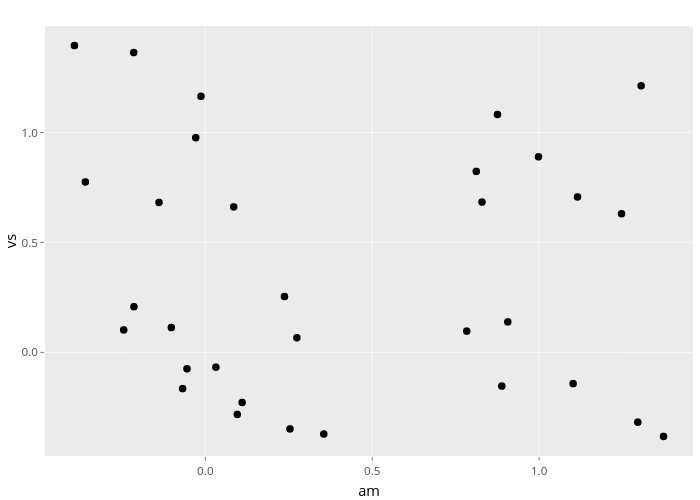
Nadhil's interactive graph and data of "vs vs am" is a scatter chart; with am in the x-axis and vs in the y-axis.. The x-axis shows values from -0.480436421819031 to 1.46103525225073. The y-axis shows values from -0.471303825965151 to 1.4842295083683.