Edit chart
Loading graph
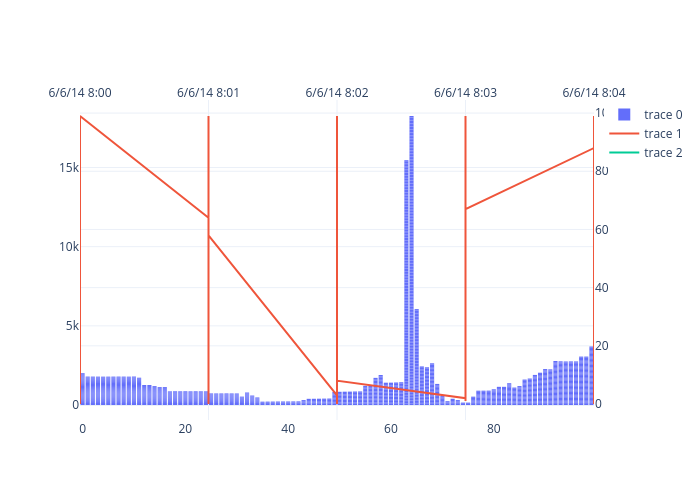
Mubarakmohammeddin's interactive graph and data is a bar chart. The x-axis shows values from -0.5 to 99.5. The y-axis shows values from -945.3888888888889 to 19262.38888888889.