Edit chart
Loading graph
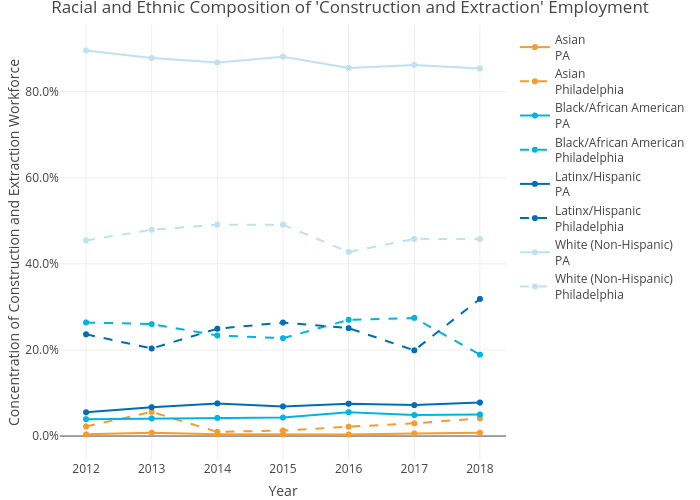
Mshields417's interactive graph and data of "Racial and Ethnic Composition of 'Construction and Extraction' Employment" is a line chart, showing AsianPA, AsianPhiladelphia, Black/African AmericanPA, Black/African AmericanPhiladelphia, Latinx/HispanicPA, Latinx/HispanicPhiladelphia, White (Non-Hispanic)PA, White (Non-Hispanic)Philadelphia; with Year in the x-axis and Concentration of Construction and Extraction Workforce in the y-axis.. The x-axis shows values from 0 to 0. The y-axis shows values from 0 to 0.