Edit chart
Loading graph
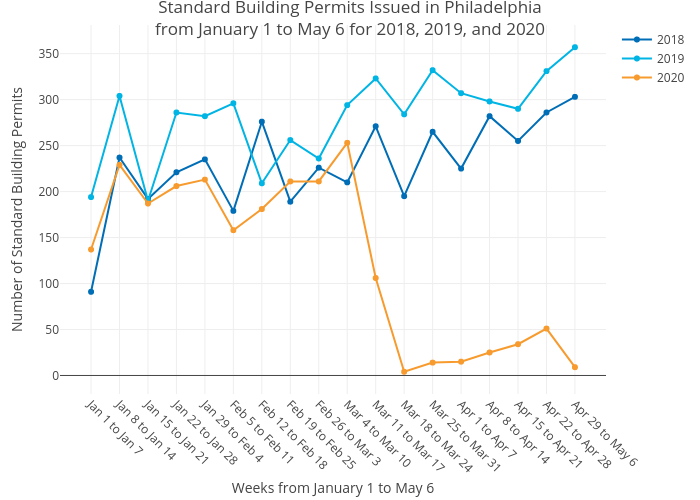
Mshields417's interactive graph and data of "Standard Building Permits Issued in Philadelphiafrom January 1 to May 6 for 2018, 2019, and 2020" is a line chart, showing 2018, 2019, 2020; with Weeks from January 1 to May 6 in the x-axis and Number of Standard Building Permits in the y-axis.. The x-axis shows values from 0 to 0. The y-axis shows values from 0 to 0.