Edit chart
Loading graph
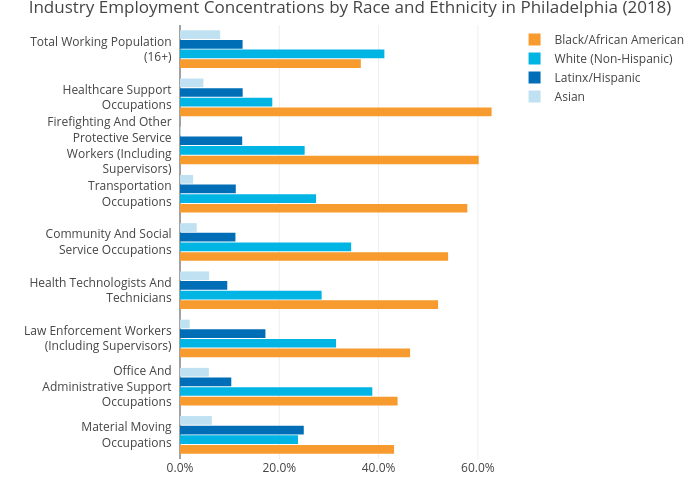
Mshields417's interactive graph and data of "Industry Employment Concentrations by Race and Ethnicity in Philadelphia (2018)" is a grouped bar chart, showing Black/African American, White (Non-Hispanic), Latinx/Hispanic, Asian. The x-axis shows values from 0 to 0. The y-axis shows values from 0 to 0.