Edit chart
Loading graph
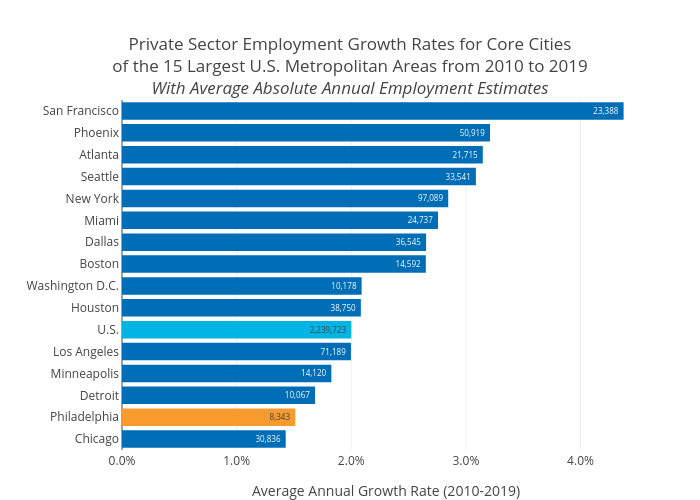
Mshields417's interactive graph and data of "Private Sector Employment Growth Rates for Core Citiesof the 15 Largest U.S. Metropolitan Areas from 2010 to 2019With Average Absolute Annual Employment Estimates" is a bar chart; with Average Annual Growth Rate (2010-2019) in the x-axis. The x-axis shows values from 0 to 0. The y-axis shows values from 0 to 0.