Edit chart
Loading graph
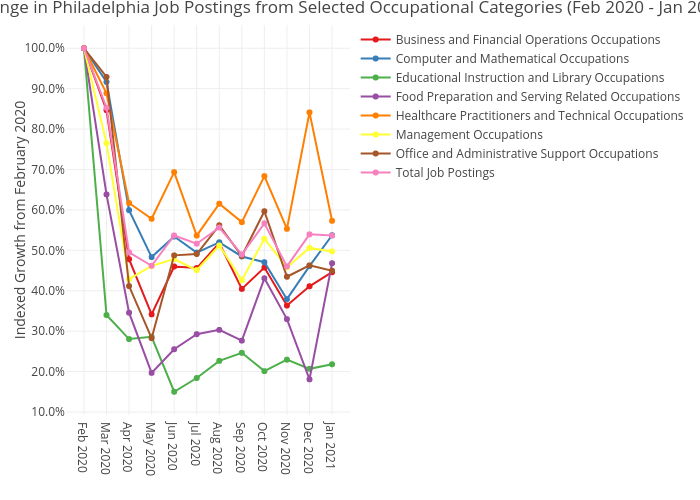
Mshields417's interactive graph and data of "Change in Philadelphia Job Postings from Selected Occupational Categories (Feb 2020 - Jan 2021)" is a line chart, showing Business and Financial Operations Occupations, Computer and Mathematical Occupations, Educational Instruction and Library Occupations, Food Preparation and Serving Related Occupations, Healthcare Practitioners and Technical Occupations, Management Occupations, Office and Administrative Support Occupations, Total Job Postings; with Indexed Growth from February 2020 in the y-axis. The x-axis shows values from 0 to 0. The y-axis shows values from 0 to 0.