Edit chart
Loading graph
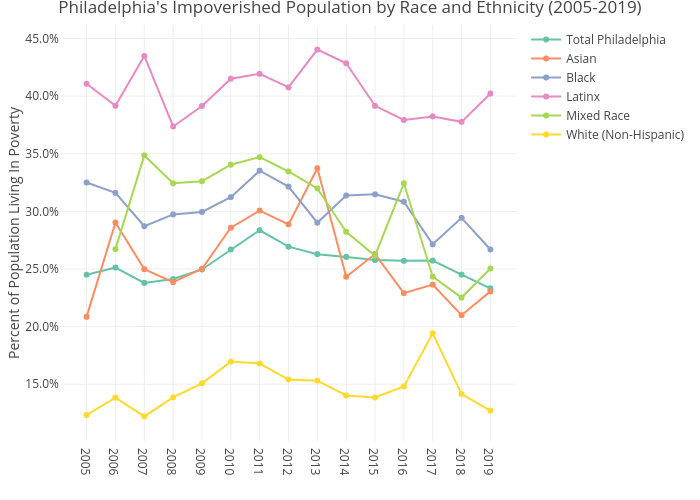
Mshields417's interactive graph and data of "Philadelphia's Impoverished Population by Race and Ethnicity (2005-2019)" is a line chart, showing Total Philadelphia, Asian, Black, Latinx, Mixed Race, White (Non-Hispanic); with Percent of Population Living In Poverty in the y-axis. The x-axis shows values from 0 to 0. The y-axis shows values from 0 to 0.