Edit chart
Loading graph
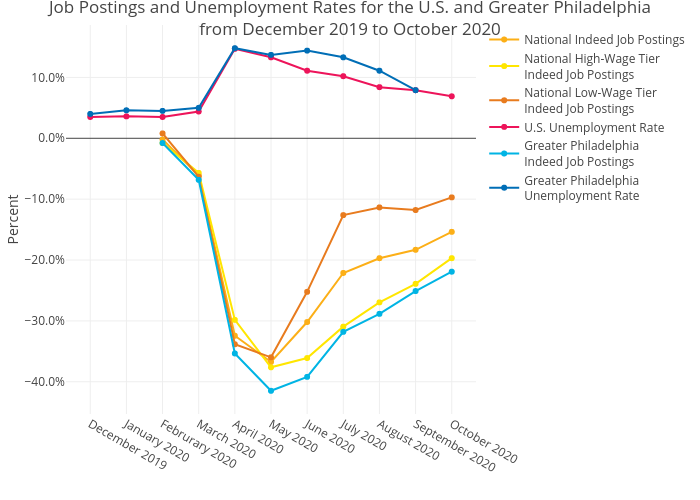
Mshields417's interactive graph and data of "Job Postings and Unemployment Rates for the U.S. and Greater Philadelphiafrom December 2019 to October 2020" is a line chart, showing National Indeed Job Postings, National High-Wage TierIndeed Job Postings, National Low-Wage TierIndeed Job Postings, U.S. Unemployment Rate, Greater PhiladelphiaIndeed Job Postings, Greater PhiladelphiaUnemployment Rate; with Percent in the y-axis. The x-axis shows values from 0 to 0. The y-axis shows values from 0 to 0.