Edit chart
Loading graph
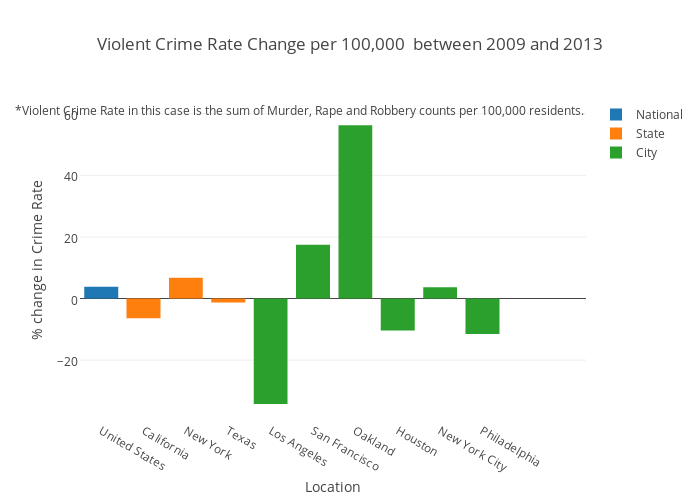
Mravicacs's interactive graph and data of "Violent Crime Rate Change per 100,000 between 2009 and 2013" is a grouped bar chart, showing National, State, City; with Location in the x-axis and % change in Crime Rate in the y-axis.. The x-axis shows values from -0.5 to 9.5. The y-axis shows values from -39.278888888888886 to 61.2988888888889. This visualization has the following annotation: *Violent Crime Rate in this case is the sum of Murder, Rape and Robbery counts per 100,000 residents.