Edit chart
Loading graph
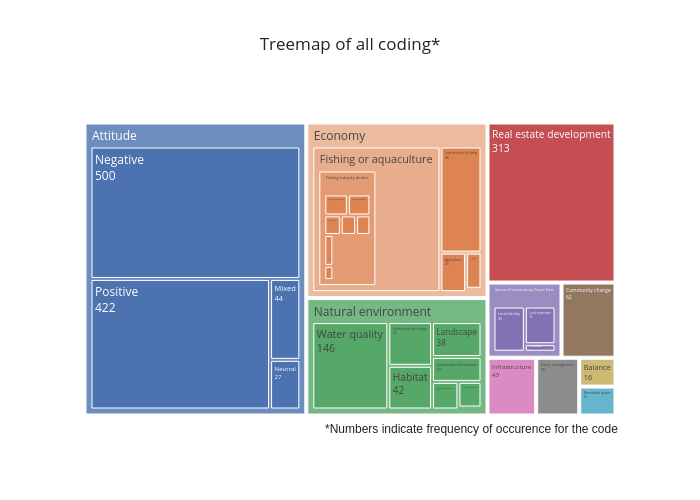
Mpoudyal's interactive graph and data of "Treemap of all coding*" is a treemap. The x-axis shows values from -1 to 6. The y-axis shows values from -1 to 4. This visualization has the following annotation: *Numbers indicate frequency of occurence for the code