Edit chart
Loading graph
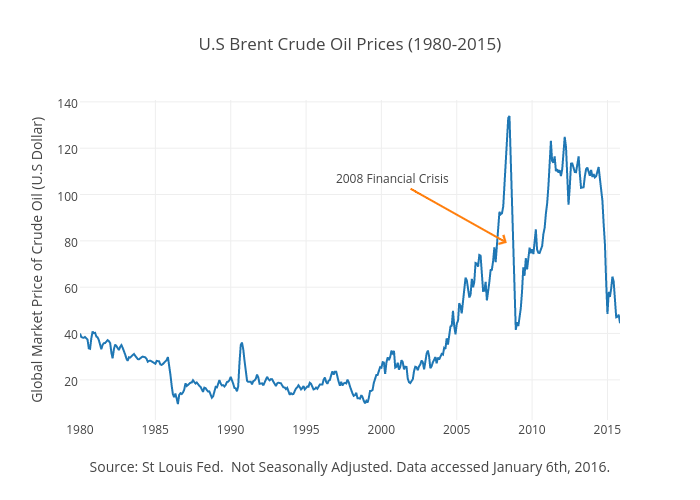
Mously.pluviose's interactive graph and data of "U.S Brent Crude Oil Prices (1980-2015)" is a scatter chart, showing Global price of Brent Crude POILBREUSDM International Monetary Fund Primary Commodity Prices (Not a Press Release) Not Seasonally Adjusted Monthly U.S. Dollars 1980-01-01 to 2015-11-01 2015-12-09 09:36:00 Value represents the benchmark prices which are representative of the global market. They are determined by the largest exporter of a given commodity. Prices are period averages in nominal U.S. dollars.; with Source: St Louis Fed. Not Seasonally Adjusted. Data accessed January 6th, 2016. in the x-axis and Global Market Price of Crude Oil (U.S Dollar) in the y-axis.. The x-axis shows values from 315550800000 to 1446350400000. The y-axis shows values from 2.652222222222223 to 140.80777777777777. This visualization has the following annotation: 2008 Financial Crisis