Edit chart
Loading graph
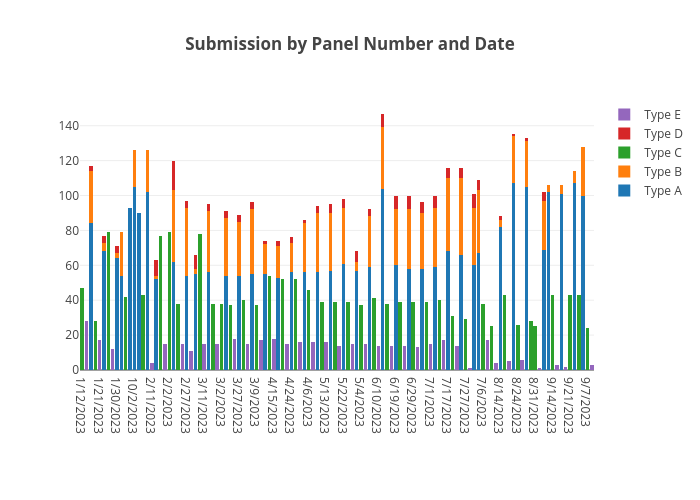
Mohamedhae1's interactive graph and data of "Submission by Panel Number and Date" is a stacked bar chart, showing Type A, Type B, Type C, Type D, Type E. The x-axis shows values from -0.5 to 117.5. The y-axis shows values from 0 to 154.73684210526315.