Edit chart
Loading graph
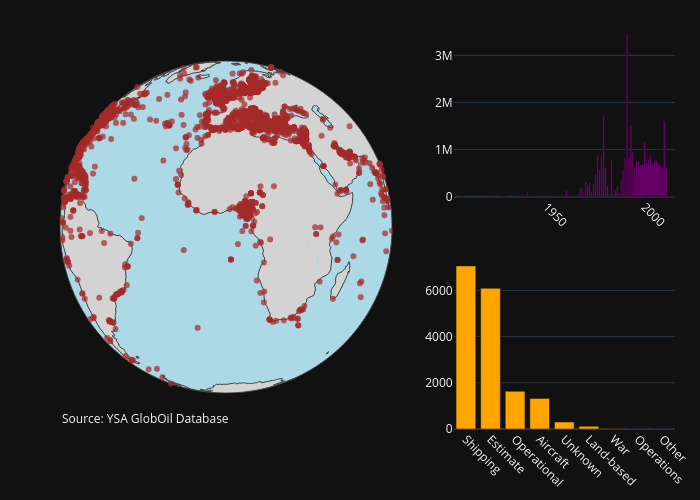
Mnemiopsis's interactive graph and data of "Oil Spill" is a scattergeo, showing Oil Spill. The x-axis shows values from 0 to 0. The y-axis shows values from 0 to 0. This visualization has the following annotation: Source: YSA GlobOil Database