Edit chart
Loading graph
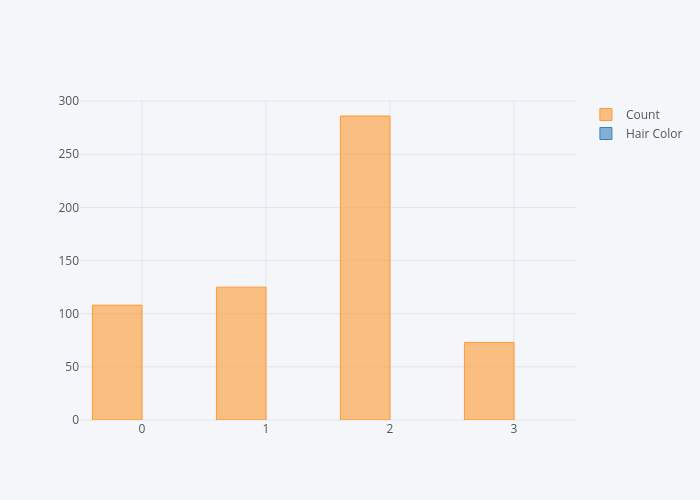
Mmyskiw0109's interactive graph and data of "{'font': {'color': '#4D5663'}}" is a bar chart, showing Count vs Hair Color. The x-axis shows values from 0 to 0. The y-axis shows values from 0 to 0.