Edit chart
Loading graph
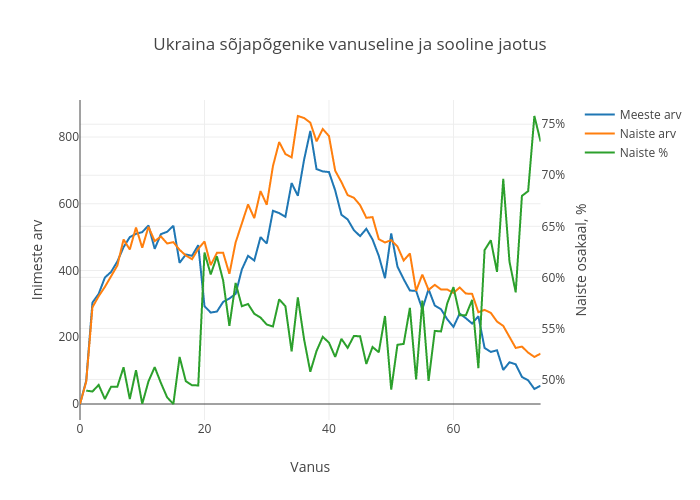
Mmasso's interactive graph and data of "Ukraina sõjapõgenike vanuseline ja sooline jaotus" is a scatter chart, showing Meeste arv, Naiste arv, Naiste %; with Vanus in the x-axis and Inimeste arv in the y-axis.. The x-axis shows values from 0 to 0. The y-axis shows values from 0 to 0.