Edit chart
Loading graph
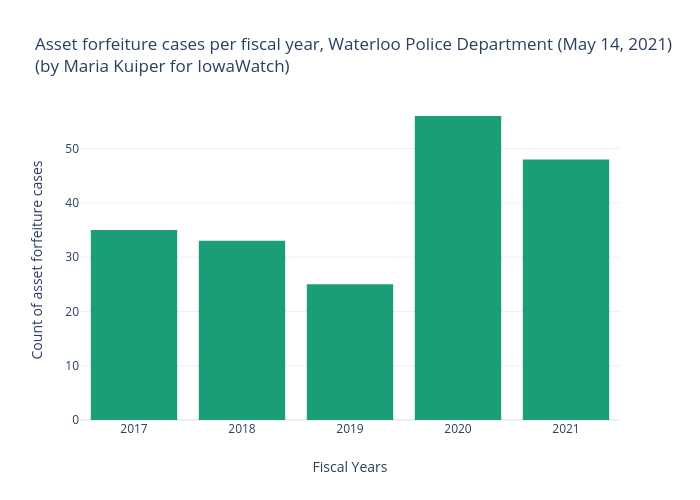
Mkkuiper's interactive graph and data of "Asset forfeiture cases per fiscal year, Waterloo Police Department (May 14, 2021)(by Maria Kuiper for IowaWatch)" is a bar chart; with Fiscal Years in the x-axis and Count of asset forfeiture cases in the y-axis.. The x-axis shows values from 2016.5 to 2021.5. The y-axis shows values from 0 to 58.94736842105263.