Edit chart
Loading graph
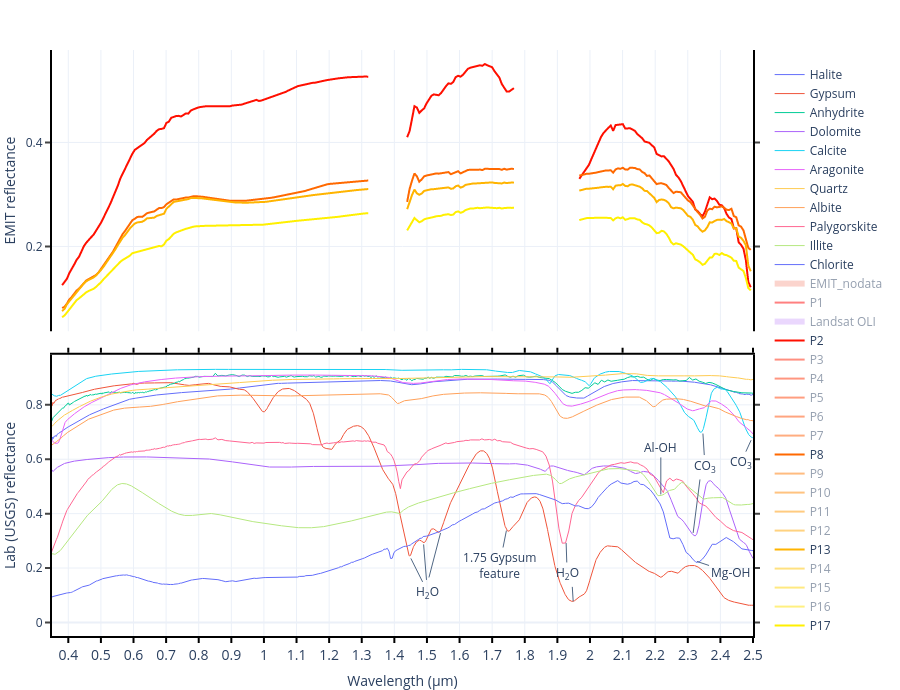
Mkemalemil's interactive graph and data of "Lab (USGS) reflectance vs Wavelength (μm)" is a line chart, showing Halite, Gypsum, Anhydrite, Dolomite, Calcite, Aragonite, Quartz, Albite, Palygorskite, Illite, Chlorite, EMIT_nodata, P1, Landsat OLI, P2, P3, P4, P5, P6, P7, %{meta.columnNames.y}, P9, %{meta.columnNames.y}, %{meta.columnNames.y}, %{meta.columnNames.y}, %{meta.columnNames.y}, %{meta.columnNames.y}, %{meta.columnNames.y}, %{meta.columnNames.y}, %{meta.columnNames.y}; with Wavelength (μm) in the x-axis and Lab (USGS) reflectance in the y-axis.. The x-axis shows values from 0.35 to 2.5. The y-axis shows values from -0.05000922222222223 to 0.9843552222222223. This visualization has the following annotations: CO3; CO3; Mg-OH; H2O; H2O; ; ; ; ; Al-OH; 1.75 Gypsumfeature