Edit chart
Loading graph
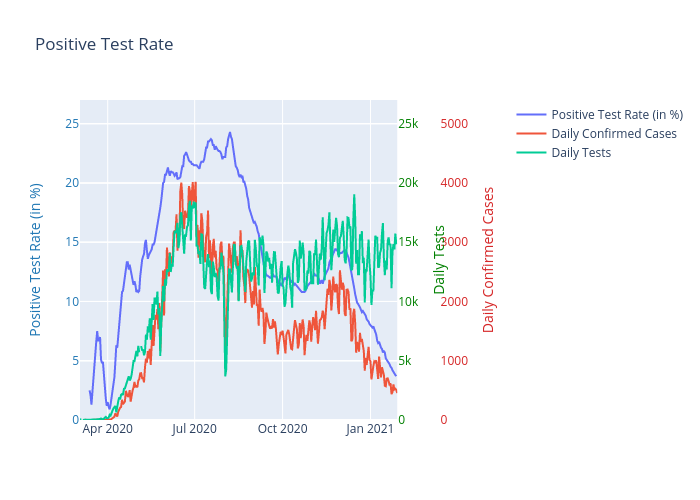
Mjonyh's interactive graph and data of "Positive Test Rate" is a scatter chart, showing Positive Test Rate (in %), Daily Confirmed Cases, Daily Tests; with Positive Test Rate (in %) in the y-axis. The x-axis shows values from 0 to 0. The y-axis shows values from 0 to 27.