Edit chart
Loading graph
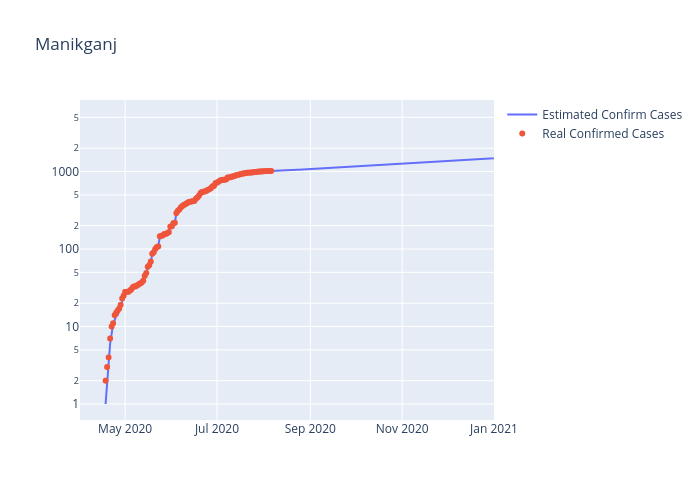
Mjonyh-phy's interactive graph and data of "Manikganj" is a scatter chart, showing Estimated Confirm Cases vs Real Confirmed Cases. The x-axis shows values from 2020-04-01 to 2021-01-01. The y-axis shows values from 0 to 0.