Edit chart
Loading graph
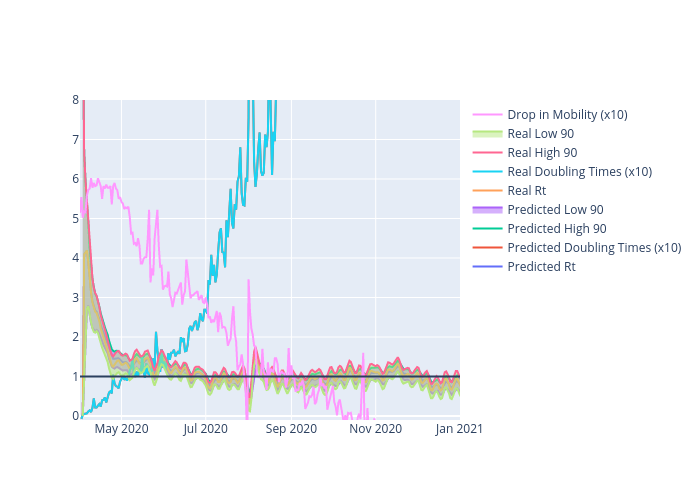
Mjonyh-phy's interactive graph and data of "Predicted Rt, Predicted Doubling Times (x10), Predicted High 90, Predicted Low 90, Real Rt, Real Doubling Times (x10), Real High 90, Real Low 90, Drop in Mobility (x10)" is a scatter chart, showing Predicted Rt, Predicted Doubling Times (x10), Predicted High 90, Predicted Low 90, Real Rt, Real Doubling Times (x10), Real High 90, Real Low 90, Drop in Mobility (x10). The x-axis shows values from 2020-04-01 to 2021-01-01. The y-axis shows values from -0.1 to 8.0.