Edit chart
Loading graph
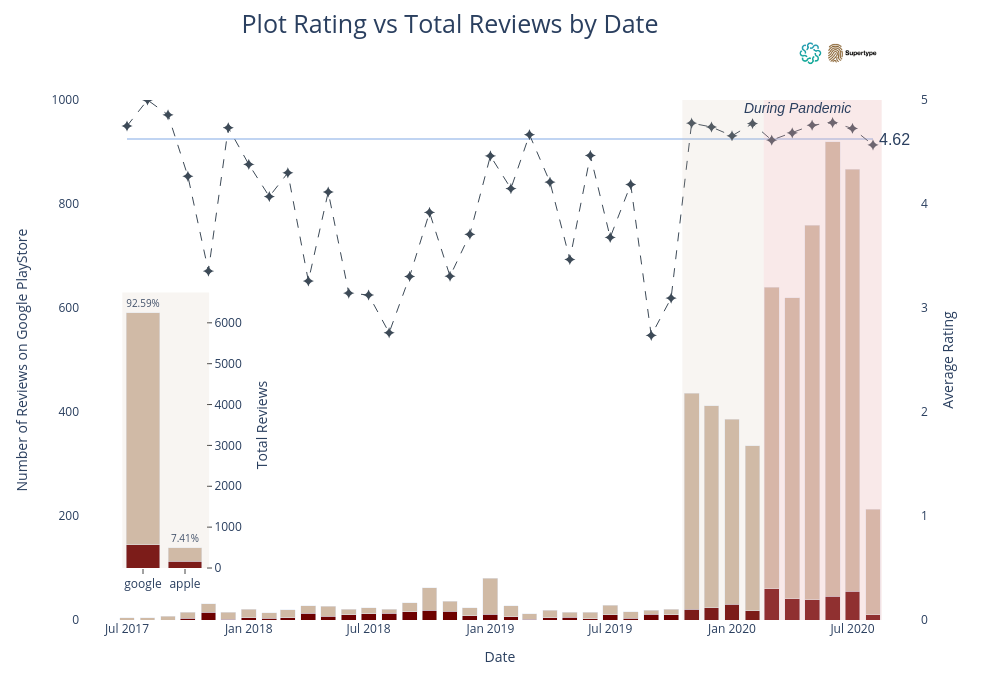
Miftahcoiri354's interactive graph and data of "Plot Rating vs Total Reviews by Date" is a stacked bar chart, showing Total Negative Reviews Google, Number Negative Reviews Google per Month, Total Negative Reviews Apple, Global Average Rating on PlayStore, Average Rating per Month, Total Reviews Apple, Total Reviews Google, Number Positive Reviews Google per Month; with Date in the x-axis and Number of Reviews on Google PlayStore in the y-axis.. The x-axis shows values from 0 to 0. The y-axis shows values from 0 to 0. This visualization has the following annotations: 4.62; During Pandemic