Edit chart
Loading graph
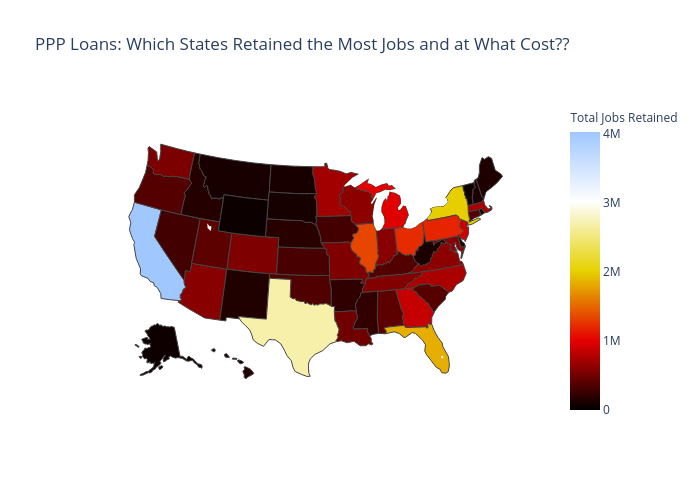
Mharman's interactive graph and data of "PPP Loans: Which States Retained the Most Jobs and at What Cost??" is a choropleth. The x-axis shows values from 0 to 0. The y-axis shows values from 0 to 0.