Edit chart
Loading graph
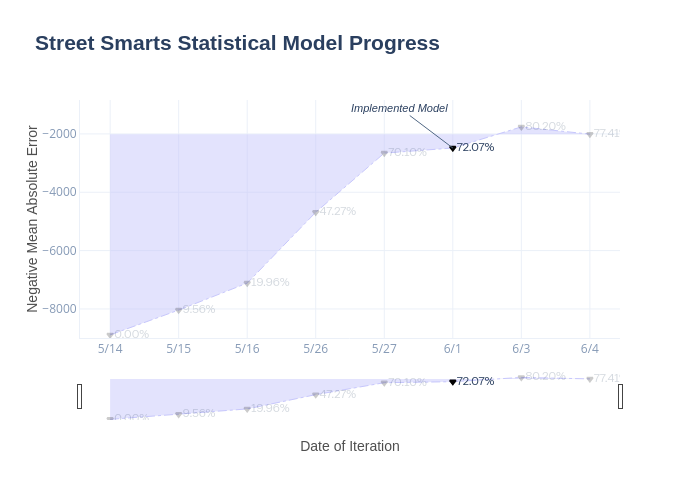
Mharman's interactive graph and data of "Street Smarts Statistical Model Progress" is a ; with Date of Iteration in the x-axis and Negative Mean Absolute Error in the y-axis.. The x-axis shows values from -0.42214544708216467 to 7.422145447082165. The y-axis shows values from -8959.894200973882 to -1382.7220008853476. This visualization has the following annotation: Implemented Model