Edit chart
Loading graph
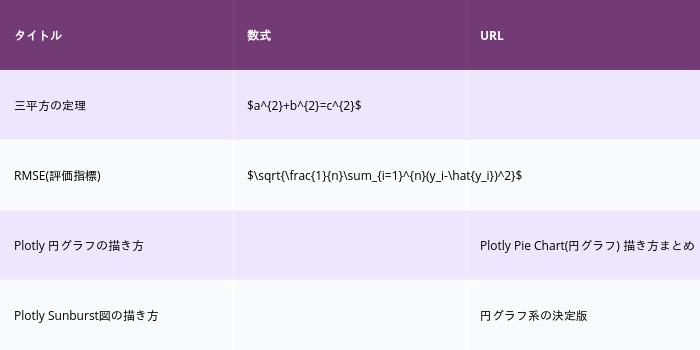
Metacrinus's interactive graph and data is a heatmap. The x-axis shows values from 0 to 0. The y-axis shows values from 0 to 0. This visualization has the following annotations: タイトル; 数式; URL; 三平方の定理; $a^{2}+b^{2}=c^{2}$; RMSE(評価指標); $\sqrt{\frac{1}{n}\sum_{i=1}^{n}(y_i-\hat{y_i})^2}$; Plotly 円グラフの描き方; Plotly Pie Chart(円グラフ) 描き方まとめ; Plotly Sunburst図の描き方; 円グラフ系の決定版