Edit chart
Loading graph
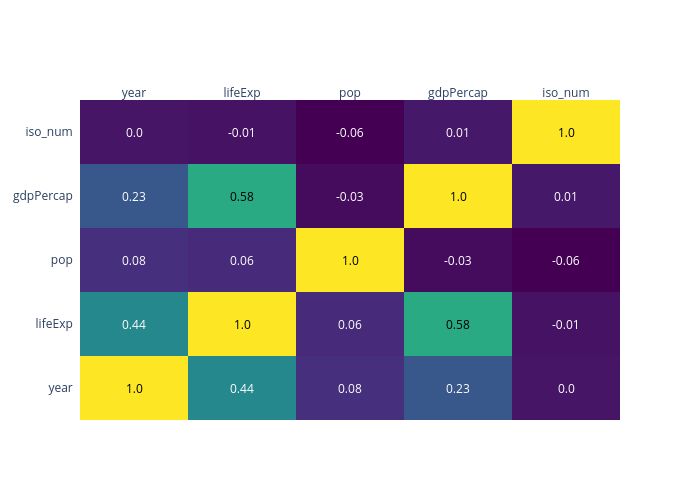
Metacrinus's interactive graph and data is a heatmap. The x-axis shows values from 0 to 0. The y-axis shows values from 0 to 0. This visualization has the following annotations: 1.0; 0.44; 0.08; 0.23; 0.0; 0.44; 1.0; 0.06; 0.58; -0.01; 0.08; 0.06; 1.0; -0.03; -0.06; 0.23; 0.58; -0.03; 1.0; 0.01; 0.0; -0.01; -0.06; 0.01; 1.0